A couple of years ago in college, I wrote a paper inspired by Hans Rosling’s Factfulness. The core idea was disorienting: the world keeps getting better on nearly every measurable metric, yet most of us are convinced it’s collapsing.
I explored why this happens: negativity bias, social media algorithms, our tendency to mistake a single data point for the whole picture.
I wanted to revisit those ideas. But just writing about it felt abstract. What if I could show it? What if there was a way to visualize how headlines and reality diverge?
That curiosity led me to start building Atlas In Context. It’s an attempt to see beyond the headlines, to map the gap between what’s trending and what’s actually happening.
Spoiler: It’s way harder than I thought. The tool isn’t finished, and in some ways, the difficulty of building it has taught me more about the problem.
This post is about those ideas, the ones from the paper, the ones I’ve picked up since, and what I’ve learned trying to turn a concept into something you can actually interact with.
The Filtered Fallacy: When Facts Become Fiction
One of the biggest blind spots I identified in that original paper was this: I assumed that a fact, by itself, conveys the complete picture.
Whenever I scrolled through social media, particularly posts about politics, conflict, climate disasters, the information displayed was designed to grab attention. And it worked. It reinforced a worldview that things were spiraling out of control.
As Rosling put it: “It is instinctive to look at a lonely number and misjudge its importance.”
Here’s an example he gives in Factfulness: Knowing that ten people died in plane crashes out of forty million commercial flights is a fact. But without context, without comparing it to other forms of travel, or historical crash rates, that fact is worse than useless. It’s misleading.
And that’s exactly how social media works in 2026.
The Magnifying Filter
Social media isn’t just a neutral information feed. It’s a magnifying filter that takes isolated, out-of-context facts and amplifies them through algorithms designed to maximize engagement. And engagement, as we all know by now, favors outrage, fear, and urgency.
This has only accelerated. In 2026, we’re not just dealing with human-curated negativity anymore. We’re swimming in:
- AI slop: Low-quality, algorithmically optimized content designed purely for virality
- Algorithmic radicalization: Platforms that learn your triggers and serve you an increasingly extreme version of reality
- Synthetic outrage: Entire narratives manufactured or distorted by generative AI
The filter has become so aggressive that a worldview shaped solely by these single-data-point amplifications can be as harmful as one shaped by outright false information.
Maybe worse, because it feels true.
More News ≠ More Suffering
Here’s another insight from Rosling that hit hard: “More news doesn’t equal more suffering.”
In 2026, we’re exposed to far more bad news, far more often, than any generation before us. For many people, social media is the news — and because these platforms reward speed and emotion over depth and context, much of what circulates is incomplete, misleading, or simply wrong.
This constant exposure becomes a breeding ground for the negativity instinct. We see more bad news, so we assume more bad things are happening. But correlation isn’t causation.
Instead of saying more, here are a few long-term trends in crucial metrics:
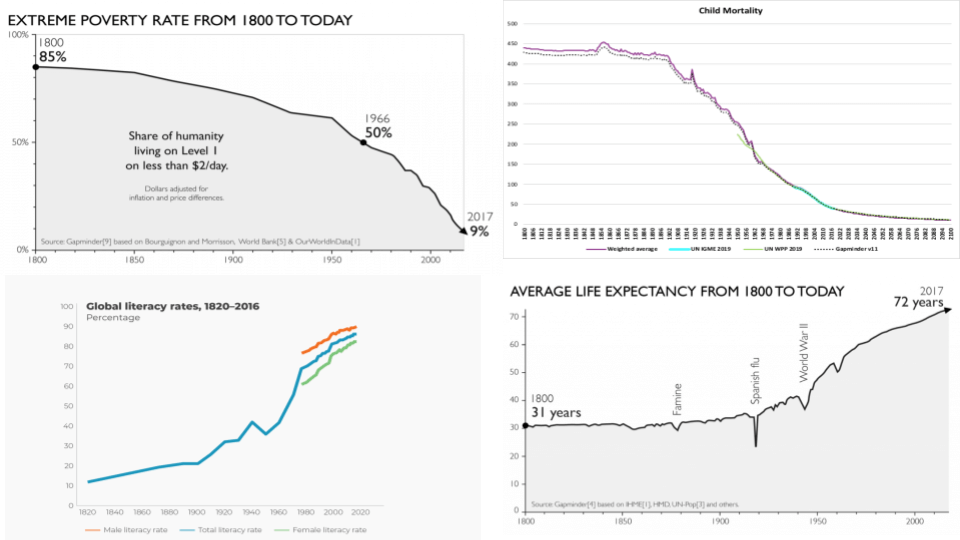
The world still has enormous problems.
But the long-term direction is far less hopeless than our feeds make it seem.
The Echo Chamber Effect
Another reality that’s become more apparent: Ideas get passed from person to person, creating the illusion of “more” news, without being based on fact.
False or misleading content spreads faster than careful context ever could. In 2026, this is turbocharged by:
- Misinformation-as-a-service: Tools that make it trivial to generate convincing but false content
- Engagement farming: Accounts that repackage old or misleading content for clicks
- Platform incentives: Algorithms that prioritize shareability over veracity
From an external standpoint, it seems obvious: “Just fact-check before you share!” But when you’re the one actively engaging, knowingly or unknowingly, the realization isn’t so obvious anymore.
This is blind-spot bias: We can spot biases in others but struggle to recognize our own.
Trying to Build the Counter-Lens (And Why It’s Harder Than It Looks)
So, I had this idea: What if I could visualize this distortion in real-time?
What if there was a tool that showed you both lenses side-by-side:
- 🔴 The Noise: What dominates feeds: conflict, disasters, breaking events
- 🟢 The Signal: Slow, steady improvements that rarely trend: declining mortality, rising literacy, infrastructure gains
That’s kinda how Atlas In Context started.
The Builder’s Paradox
Here’s where it gets interesting (and humbling):
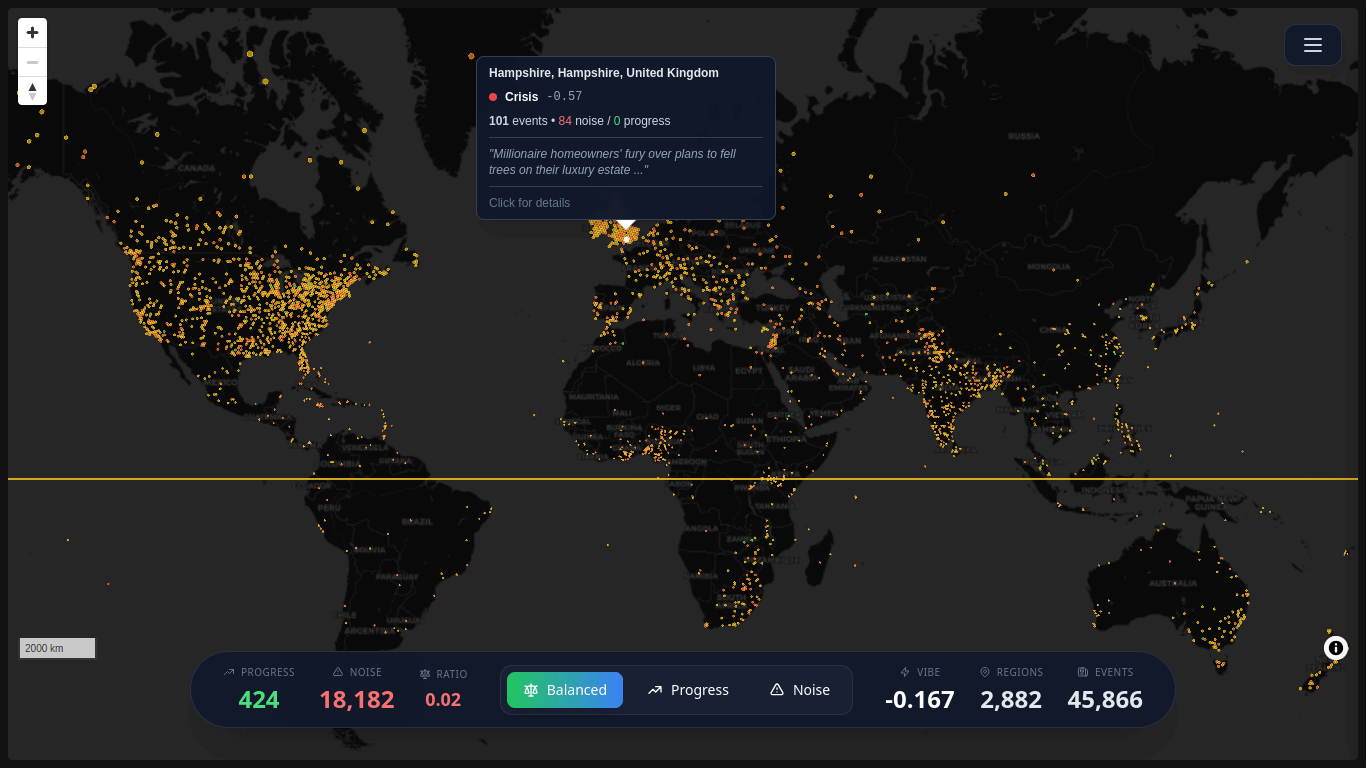
The tool currently pulls data from GDELT, which aggregates global news events. The problem? News itself is part of the “noise” that amplifies distorted views. So right now, if you visit Atlas In Context, you’ll see a global “vibe” stat that skews negative.
Which, ironically, proves the exact point I’m trying to make.
The algorithm serves you what’s loud, not what’s true. And even when you’re deliberately trying to escape that filter, it’s incredibly hard to find data sources that represent the other side — the quiet progress, the incremental wins, the things that don’t make headlines.
I’m still figuring out how to build that second lens. How do you visualize “things getting better” when improvement doesn’t come with breaking news alerts? How do you aggregate decade-long trends into something that feels immediate and visceral?
It’s a work in progress. Very much so.
What It Does (Right Now)
The current version of Atlas In Context uses a live data pipeline:
GDELT API (Live Events)
↓
Extract & categorize (noise vs context)
↓
Aggregate into H3 hexagonal grids
↓
Generate compressed GeoJSON assets
↓
Auto-deploy via GitHub Actions
↓
Serve via Cloudflare Pages + CDN
Each region on the map reflects a calculated “vibe” based on event density and type. You can explore the map, see what’s happening in different areas, toggle views.
The whole system is designed to be stateless, cache-friendly, and cheap to run.
But the real work, showing the progress side of the equation, is still ahead. I’m exploring ways to incorporate:
- Long-term development indicators (health, education, poverty)
- Infrastructure improvements that don’t trend
- Gradual policy wins
- Regional context that puts “breaking news” in perspective
If you have ideas (or want to contribute), the project is open-source:
👉 GitHub: AtlasInContext
The Vibe Formula (Technical Details)
For those curious about the math...
Right now, I’m calculating each region’s “vibe” using a weighted formula:
Vibe Score = (0.6 × Theme Balance) + (0.4 × Normalized Tone)
Where:
-
Theme Balance: Ratio of progress themes to noise themes in the region’s events
(avg_progress - avg_noise) / (avg_progress + avg_noise + 0.1)
Range: -1 (all noise) to +1 (all progress) -
Normalized Tone: GDELT’s average sentiment score, normalized to -1 to +1
tone / 10.0(clamped between -1 and 1)
The 60/40 weighting is arbitrary. I’m prioritizing what stories are about over how they’re framed. This is definitely up for debate.
Why this is still flawed:
- GDELT itself is news-based, so it inherently skews toward “noise”
- The theme weights are manually assigned (subject to my own biases)
- Progress metrics aren’t integrated yet (that’s the missing lens)
- The 0.6/0.4 split is a guess, not science
This is very much a work in progress. If you have ideas for better approaches, open an issue.
What It Could Become
Eventually, the vision is this: You open the page, see a global map that shows you both lenses. You can explore what’s trending, but you also see context, the things that aren’t trending but matter more.
Top stories alongside quiet wins. Headlines next to historical perspective.
We’re not there yet. But the process of trying to build it has been instructive in its own right.
Humility in Learning: Understanding vs Knowing
One idea from my original paper that feels even more urgent in 2026: epistemic humility.
When AI can confidently generate answers to anything, when algorithms serve you exactly what you want to hear, and when every piece of content is optimized for your existing beliefs - choosing to remain uncertain is a radical act.
But here’s something I’ve learned:
Being open-minded enough to learn isn’t enough. You have to actually understand what you learn.
There’s a difference between knowing facts and understanding what those facts mean in context.
Learn to Understand, Not Just to Know
When I look at the charts Rosling shared in Factfulness: He didn’t just know the numbers. He understood what they meant, how they connected, why they mattered.
In 2026, it’s easy to “know” things:
- You can ask an AI for any statistic
- You can screenshot a chart and share it
- You can memorize talking points
But understanding requires:
- Seeing how data points relate to each other
- Recognizing what’s missing from the frame
- Questioning whether your source represents signal or noise
- Asking whether you’re looking at a trend or an outlier
This becomes especially critical when dealing with information about politics, war, global issues - topics where surface-level knowledge can do real harm.
The Responsibility to Understand Before You Amplify
Ideas, naturally, get passed from person to person without being based on fact. In 2026, this is turbocharged by tools that make it trivial to generate and spread content.
So I try to hold myself to this standard:
- Before sharing something online, pause and assess
- Don’t just ask “Is this true?” but “Is this complete?”
- Recognize that you have a responsibility to understand before you amplify
Sometimes I still get it wrong. But in an age of infinite information and finite attention, it feels like the only responsible approach.
The Meta-Lesson
Here’s something I didn’t expect when I started working on Atlas In Context:
Trying to build a tool that visualizes this problem taught me more about the problem itself.
When you’re writing about filtered information, you can talk about it abstractly. You can cite Rosling, reference studies, make the intellectual argument.
But when you actually try to source data that represents “the good stuff” - the progress, the improvements, the quiet wins - you realize how deeply the filter goes.
News APIs are optimized for events, not trends.
Databases track what happened, not what’s been slowly improving.
Even well-intentioned data sources have a recency bias built in.
The infrastructure of information itself is biased toward the urgent and away from the important.
That’s not something I fully understood until I tried to build something that needed both sides of the equation.
So maybe that’s the real insight here: Sometimes the best way to understand a problem is to try to solve it and fail in interesting ways.
What This Means (And What I’m Still Learning)
I want to end on a hopeful note: If we can recognize our biases, we can navigate them.
But at the same time, I want to be honest about the challenges:
Recognition isn’t enough. We need better tools. And building better tools is really, really hard.
Even when you’re trying to escape the algorithm, it’s difficult to find signal in all the noise. Data sources are biased toward events, not trends. News is optimized for urgency, not context. Progress is slow and unsexy.
So where does that leave us?
I think the answer is a combination of:
- Individual humility: Staying open to being wrong, seeking context over confirmation
- Better tools: Not just for consuming information, but for interrogating it
- Collective effort: This stuff is too hard for one person to solve
Atlas In Context is my small contribution to that second part. It’s not perfect. It’s not finished. But it’s a start.
If you’re curious, you can explore what’s there so far:
👉 atlasincontext.srirams.me
And if you have ideas or want to help build the other side of this (the “progress” lens):
👉 GitHub: AtlasInContext
The world isn’t perfect. Progress is uneven, fragile, and sometimes reversible.
But the bigger danger right now isn’t ignorance of suffering, it’s losing sight of improvement. Because when people believe nothing is getting better, they stop believing improvement is possible at all.
And that might be the most distorting filter of all.