Atlas In Context - See the world beyond headlines
Back in college, I wrote a paper inspired by Hans Rosling’s work especially around ideas like the negativity instinct, how social media amplifies extreme events, and how that shapes a distorted view of the world. The core argument was simple: the world, on average, keeps getting better but the way information is filtered makes it feel like it’s constantly falling apart.
Much later, while revisiting that paper to turn it into a blog post, I realized that writing about this effect felt abstract. I wanted a visual. Something that showed how headlines and reality can diverge.
That curiosity spiraled into this project.
Atlas In Context is a live, interactive experiment, built mostly out of fun, to explore how our perception of the world changes depending on the lens we look through.
The Core Idea
The app presents the world through two competing lenses:
- Headline Noise (Red): What dominates news cycles, conflict, disasters, spikes of violence.
- Global Progress (Green): Slow, steady improvements that rarely trend, health, safety, education, quality of life.
Both are real. But they’re not weighted equally in our minds.
Atlas In Context exists to make that imbalance visible.
The “Why” Behind It
This project is heavily influenced by a few ideas that kept resurfacing for me:
- The Negativity Instinct (Rosling): Bad news is more noticeable than good.
- The Availability Heuristic: We judge the world based on what’s easiest to recall, not what’s statistically true.
- Quiet Progress: Improvements happen gradually, without headlines.
- Social Media Filters: Algorithms reward outrage and urgency, not context.
Rather than arguing these points in text, this tool tries to render them.
What the App Does (It is still a work in progress, so no promises -_- )
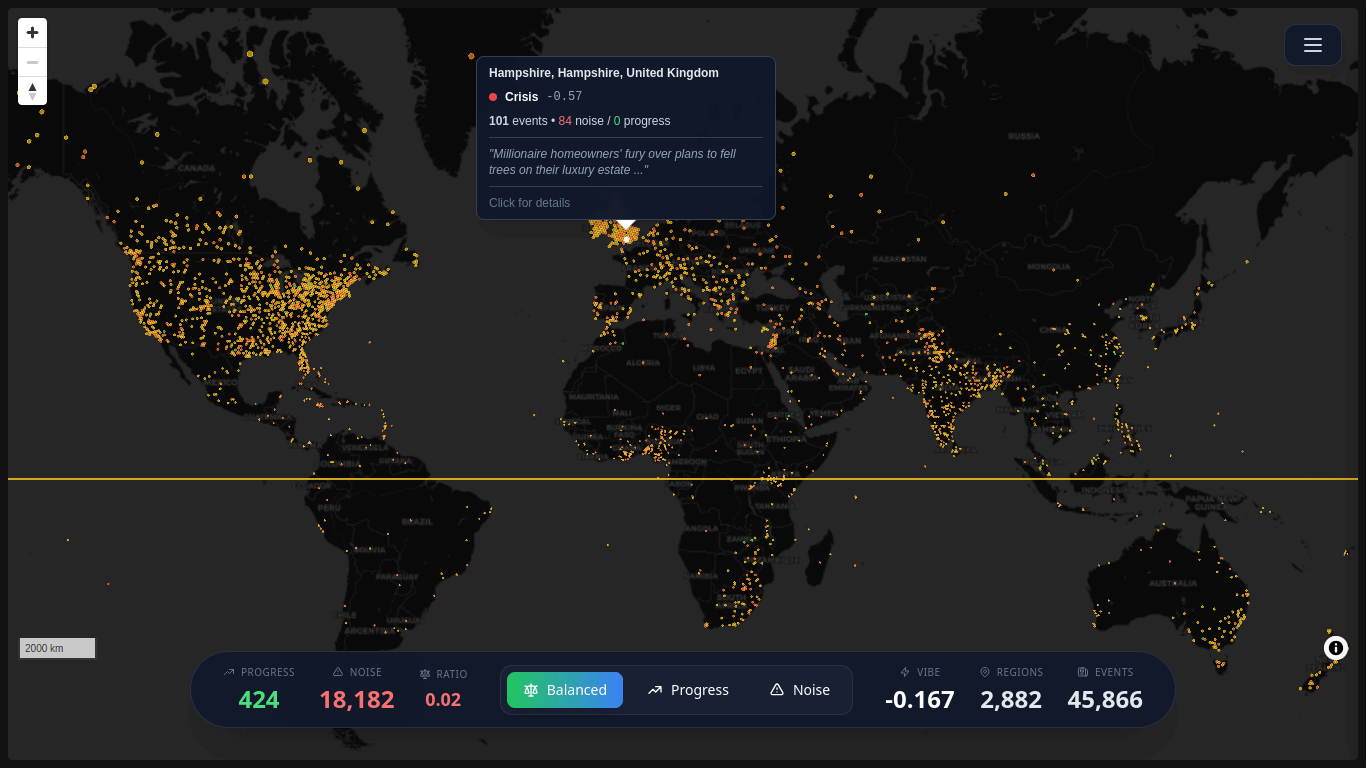
Dual-Lens World Map
A global map where each region reflects a calculated “vibe”:
- Red when dominated by negative, loud events
- Green when long-term progress outweighs the noise
You can toggle views to see how dramatically perception shifts.
H3-Based Grid System
Instead of plotting chaotic points, the world is divided into hexagonal cells using Uber’s H3 indexing system. Each hex aggregates events and progress signals into a single, interpretable value.
This keeps the visualization scalable, performant, and visually calm.
Insight Feed
Green zones aren’t just abstract numbers. The sidebar translates them into human-readable insights, like:
“In this region, child mortality has dropped significantly over your lifetime, even though today’s headlines focus on a local protest.”
Global Pulse
A ticker-style view of humanity’s quiet wins — vaccinations, poverty exits, reforestation — meant to counterbalance the constant drip of breaking news.
Data & Pipeline (High Level)
Live global event data flows through an automated ingestion pipeline:
GDELT API (Live Events)
↓
Extract & categorize (noise vs context)
↓
Aggregate into H3 grids
↓
Generate compressed GeoJSON assets
↓
Auto-deploy via GitHub Actions
↓
Serve via Cloudflare Pages + CDN
Everything is built to be:
- Stateless
- Cache-friendly
- Cheap to run
- Easy to reason about
All final assets are gzipped at birth, with client-side decompression using native browser APIs.
Not a Product
It’s just a thinking tool. A visual argument. A way to explore how data, framing, and interfaces shape belief. I built it mostly to see if something like this could exist and what it feels like to interact with it.
You can explore it live at: https://atlasincontext.srirams.me
You can find the code and contribute here: https://github.com/sriramsme/AtlasInContext